General Description
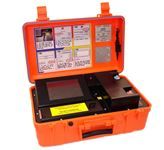
The GasID uses the same interferometer and outer enclosure as the HazMatID, but replaces the ATR interface with a gas cell and includes a handheld gas and vapor collection device that interfaces to that cell. The external packaging of the GasID includes a hardened plastic enclosure measuring 44.4 x 30.5 x 19 cm (17.5” x 12” x 7.5”) with a mass of 11.3 kg (25 lbs.). When the lid is open, the exposed system components include the computer screen and the chemical sampling interface. The sampling interface consists of two ports (inlet and exhaust) leading to the 44 cm path length transmission cell and accommodates either of two sample collection devices provided with the system. Because the GasID has exposed ports, the instrument is not recommended for use in the hot zone, rather, the sample collection devices are decon-able and permitted for use in the contaminated area of interest.With non-technical users in mind, the software interface on the GasID is simple and easily viewed and controlled when wearing personal protective equipment. A list of the best library matches found out of a database of 5500 spectra is shown in rank order along with the correlation values with respect to the library. The user can then highlight one of the library hits and display the library spectrum versus the unknown sample spectrum for visual confirmation of the match. Advanced software controls also allow users to add measured spectra to the instrument library, perform mixture analysis functions, and access the NIOSH database to determine chemical toxicities.
Technical Description
Infrared (IR) spectroscopy can be used to interrogate the structures of molecules by measuring the resonant frequencies of vibrational modes within the molecule. These frequencies are identified by measuring the transmission of IR light through a sample. Those vibrational modes that can experience a change in dipole moment upon the absorption of IR light will be IR active and will produce a peak in the IR spectrum. Therefore, molecules that contain highly polar chemical bonds, such as water (H2O), carbon dioxide (CO2), and acetone ((CH3)2CO)), will produce strong IR spectra. Notably, linear diatomic molecules, such as nitrogen (N2), oxygen (O2), and hydrogen (H2), have no transition dipole moment and thus, do not absorb IR light and do not interfere with the IR measurement of other components of air samples.
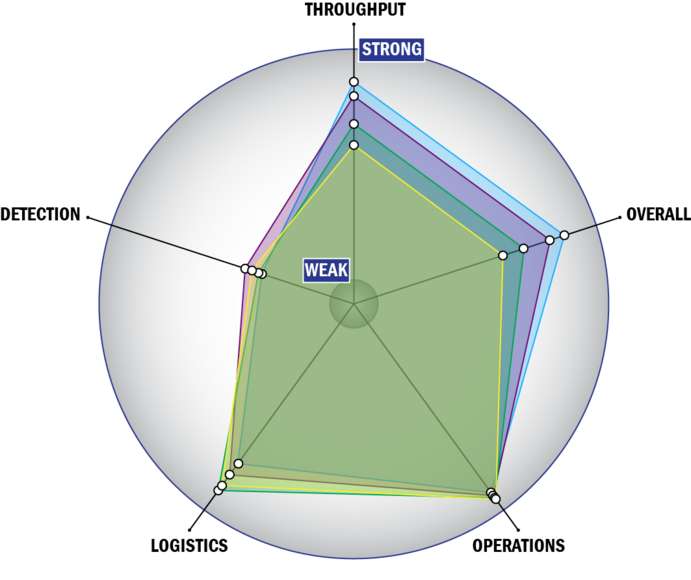
Evaluation Criteria
THROUGHPUT:
- Between 2 and 15 minutes for detection
- 1 sample, >10 tests/sample per run
- Less than 32 samples every 2 hours
- The system or device is currently fully automated
- Device or system is intended for multiple detection assays
- 0-1 solutions, buffer, eluents, and/or reagents
- 1 component
- No set-up of the system is required
- 1-2 steps are required for detection
LOGISTICS:
- An afternoon of training and some technical skills required
- Approximately the size of a toaster
- Between 5 and 25 kg
- Wireless and wired connections are available
- System or device uses batteries
- 2-4 hours battery life
OPERATIONS:
- Can be used from 4°C to 41°C
- Performance is not influenced by relative humidity
- Greater than 3 years shelf life
- Greater than 10 years expected life
- Results can be viewed in real-time
- The system could easily be adapted into a fully autonomous system
- The system software is closed and not available for modification
- The system hardware is closed and not available for modification
DETECTION:
- Greater than 250 µL
- Superior specificity. System has a false alarm rate approaching zero (~0%)
- > 1x10⁻³ mg/m3
- 100 ppm-1 ppt
- System currently can identify aerosolized chemical agent
- Possible system could identify liquid chemical agent
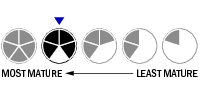


 Top Tier
 Second Tier
 Third Tier
 Fourth Tier
 Bottom Tier

 Rate Detector
 DOWNLOAD Fact Sheet